Market Outlook
April 6, 2017
Market Cues
Domestic Indices
Chg (%)
(Pts)
(Close)
Indian markets are likely to open negative tracking the SGX Nifty & global cues.
BSE Sensex
0.2
64
29,974
U.S. markets ended lower Wednesday, suffering a late selloff after minutes for
Nifty
0.3
27
9,265
March showed Federal Reserve to begin unwinding its gigantic balance sheet before
Mid Cap
0.5
66
14,256
the end of the year. The Dow Jones Industrial Average closed with a loss of 0.2%, at
Small Cap
1.1
164
14,785
20,648. The S&P 500 finished down 0.3%, at 2,353. At first, the broader market
retreated slightly from intraday highs after the Federal Reserve released minutes
Bankex
0.5
127
24,711
from its March meeting, noting plans to reduce its $4.5 trillion balance sheet this
year and that some Fed members thought stock prices were quite high relative to
Global Indices
Chg (%)
(Pts)
(Close)
standard valuation measures.
Dow Jones
(0.2)
(41)
20,648
The FTSE 100 gained 0.13%, to close at 7,332 after data showed better-than-
Nasdaq
(0.6)
(34)
5,864
expected growth in the service sector. The Markit/CIPS PMI for services sector rose to
FTSE
0.1
10
7,332
55, vs. expectations of 53.5. The London market gained 0.13%, to 7,332.
Nikkei
(0.9)
(166)
18,695
The BSE Sensex crossed the 30,000 mark for the first time in about 2 years, as the
Hang Seng
(0.5)
(133)
24,268
Indian equity markets went up for a consecutive session. The Sensex gained 0.2%,
Shanghai Com
(0.0)
(1)
3,269
during the session to end at 29,974, while the NSE’s Nifty closed at 9,265 0.3%
higher. Both indices closed at new lifetime highs. The broader markets continued to
Advances / Declines
BSE
NSE
outperform benchmarks, with the Nifty Midcap rising 0.77% and Smallcap, 1.29%.
Advances
2,000
1,215
News Analysis
Declines
941
494
Shankara Building Products IPO update
Unchanged
150
56
Detailed analysis on Pg2
Volumes (` Cr)
Investor’s Ready Reckoner
BSE
4,391
Key Domestic & Global Indicators
NSE
30,287
Stock Watch: Latest investment recommendations on 150+ stocks
Refer Pg5 onwards
Net Inflows (` Cr)
Net
Mtd
Ytd
Top Picks
FII
584
584
44,805
CMP
Target
Upside
Company
Sector
Rating
MFs
196
196
9,634
(`)
(`)
(%)
Amara Raja Batteries Auto & Auto AncillaryAccumulate
896
1,009
12.6
HCL Tech
IT
Buy
853
1,000
17.2
Top Gainers
Price (`)
Chg (%)
Power Grid Corp.
Power
Accumulate
195
223
14.5
Sobha
400
16.5
Navkar Corp.
Others
Buy
181
265
46.4
Unitech
6
15.4
KEI Industries
Others
Accumulate
195
207
6.2
Godrejprop
436
8.4
More Top Picks on Pg3
Vrllog
343
8.2
Key Upcoming Events
Den
92
8.2
Previous
Consensus
Date
Region
Event Description
Reading
Expectations
Apr 06, 2017 US
Initial Jobless claims
258.00
250.00
Top Losers
Price (`)
Chg (%)
Apr 06, 2017 India
RBI Repo rate
6.25
6.25
Bajajelec
348
(6.6)
Apr 06, 2017 India
RBI Reverse Repo rate
5.75
5.75
Deltacorp
203
(5.2)
Apr 06, 2017 India
RBI Cash Reserve ratio
4.00
4.00
Hdfc
1,490
(2.8)
Apr 07, 2017 US
Unemployment rate
4.70
4.70
Apr 07, 2017 UK
Industrial Production (YoY)
3.20
3.70
Gspl
161
(2.7)
More Events on Pg4
Bharatfin
797
(2.6)
As on April 05, 2017
Market Outlook
April 6, 2017
News Analysis
Shankara Building Products IPO update
The IPO of Shankara Building Products listed on the exchanges at a premium of
around 35%. Against the issue price of Rs.460 (at the upper end of the band), the
stock listed above the Rs.600 mark and has managed to hold around the Rs.620
levels. Shankara is a niche player in the organized retailing of home improvement
and building products. The big positive take-away for the investors is that
Shankara has been consistently increasing the share of its retail business and
reducing the share of institutional business. From a profit traction point of view,
this is important because retail happens to be the more profitable side of this
business, which is evident from the company’s OPM improving from 4.6% in 2014
to 6.4% in 2017.
We had recommended investing in the IPO as the valuation at 18.2 times earnings
was attractive considering the earnings traction. With a premium listing, the
valuations stand at 24.2 times earnings. Existing retail investors can look to take
profits off the table.
Economic and Political News
US stocks fall as Fed minutes reverse earlier rally
RBI policy: Rate cut is not in focus this time around; something else is
Card, mobile banking volumes fall, sharp rise in UPI
New rail regulator to decide on tariff, ease investment process
Nitin Gadkari keen to achieve 40 km a day road construction target
Corporate News
India's solar energy expanded by record 5,525 MW
Banks want RBI to relax norms for loans to highly indebted firms
H1B visa overhaul could benefit big tech companies
Essar plans `10,000cr port in Gujarat
Gillette, bleeding market share, cuts prices of razors
Market Outlook
April 6, 2017
Top Picks ★★★★★
Large Cap
Market Cap
CMP
Target
Upside
Company
Rationale
(` Cr)
(`)
(`)
(%)
To outpace battery industry growth due to better technological
Amara Raja Batteries
15,307
896
1,009
12.6products leading to market share gains in both the automotive
OEM and replacement segments.
The stock is trading at attractive valuations and is factoring all the
HCL Tech
1,20,377
853
1,000
17.2
bad news.
Back on the growth trend, expect a long term growth of 14% to
Infosys
2,28,638
995
1,249
25.4
be a US$20bn in FY2020.
One of the largest pharma companies with strong international
Lupin
65,610
1,453
1,809
24.5presence. It has a rich pipeline of ANDAs which is also one of the
largest among the generic companies.
Going forward, we expect the company to report strong top-line
Power Grid Corporation
1,01,885
195
223
14.5CAGR of ~16% and bottom-line CAGR of ~19% over FY16-18
on back of strong capitalization guidance
Source: Company, AngelResearch
Mid Cap
Market Cap
CMP
Target
Upside
Company
Rationale
(` Cr)
(`)
(`)
(%)
We expect the company would report strong profitability
Asian Granito
1,112
370
390
5.5
owing to better product mix, higher B2C sales and
amalgamation synergy.
Among the top 4 players in the consumer durables segment.
Bajaj Electricals
3,525
348
395
13.5
Improved profitability backed by turn around in E&P segment.
Strong order book lends earnings visibility.
Favourable outlook for the AC industry to augur well for
Cooling products business which is out pacing the market
Blue Star
6,646
695
760
9.3
growth. EMPPAC division's profitability to improve once
operating environment turns around.
Strong loan growth backed by diversified loan portfolio and
Equitas Holdings
5,738
170
235
38.4
adequate CAR. ROE & ROA likely to remain decent as risk of
dilution remains low. Attractive valuations considering growth.
Economic recovery to have favourable impact on advertising
& circulation revenue growth. Further, the acquisition of a
Jagran Prakashan
6,033
185
225
21.9
radio business (Radio City) would also boost the company's
revenue growth.
High order book execution in EPC segment, rising B2C sales
KEI Industries
1,517
195
207
6.2
and higher exports to boost the revenues and profitability
Speedier execution and speedier sales, strong revenue
Mahindra Lifespace
1,657
404
522
29.3
visibility in short-to-long run, attractive valuations
Higher growth in domestic branded sales and healthy export
Mirza International
1,072
89
107
20.1
to boost the profitability.
Massive capacity expansion along with rail advantage at ICD
Navkar Corporation
2,581
181
265
46.4
as well CFS augurs well for the company
Strong brands and distribution network would boost growth
Siyaram Silk Mills
1,594
1,700
1,872
10.1
going ahead. Stock currently trades at an inexpensive
valuation.
Market leadership in Hindi news genre and no. 2 viewership
ranking in English news genre, exit from the radio business,
TV Today Network
1,654
277
344
24.1
and anticipated growth in ad spends by corporates to benefit
the stock.
Source: Company, Angel Research
Market Outlook
April 6, 2017
Key Upcoming Events
Global economic events release calendar
Bloomberg Data
Date
Time
Country
Event Description
Unit
Period
Last Reported
Estimated
6:00 PM US
Initial Jobless claims
Thousands
Apr 1
258.00
250.00
Apr 06, 2017
2:30 PM India
RBI Repo rate
%
Apr 6
6.25
6.25
2:30 PM India
RBI Reverse Repo rate
%
Apr 6
5.75
5.75
2:30 PM India
RBI Cash Reserve ratio
%
Apr 6
4.00
4.00
Apr 07, 2017
6:00 PM US
Unemployment rate
%
Mar
4.70
4.70
2:00 PM UK
Industrial Production (YoY)
% Change
Feb
3.20
3.70
6:00 PM US
Change in Nonfarm payrolls
Thousands
Mar
235.00
175.00
Apr 10, 2017
India
Imports YoY%
% Change
Mar
21.76
India
Exports YoY%
% Change
Mar
17.48
Apr 11, 2017
2:00 PM UK
CPI (YoY)
% Change
Mar
2.30
Apr 12, 2017
2:00 PM UK
Jobless claims change
% Change
Mar
-11.30
5:30 PM India
Industrial Production YoY
% Change
Feb
2.70
7:00 AM China
Consumer Price Index (YoY)
% Change
Mar
0.80
1.00
Apr 13, 2017
US
Producer Price Index (mom)
% Change
Mar
0.10
China
Exports YoY%
% Change
Mar
-1.30
3.10
Apr 14, 2017
6:00 PM
US
Consumer price index (mom)
% Change
Mar
0.10
0.00
April 17, 2017
7:30 AM China
Industrial Production (YoY)
% Change
Mar
6.00
6.30
12:00 PM India
Monthly Wholesale Prices YoY%
% Change
Mar
6.55
7:30 AM China
Real GDP (YoY)
% Change
1Q
6.80
6.80
Apr 18, 2017
6:00 PM US
Housing Starts
Thousands
Mar
1,288.00
1275.00
6:00 PM US
Building permits
Thousands
Mar
1,216.00
1260.00
6:45 PM US
Industrial Production
%
Mar
0.11
0.50
Apr 19, 2017
2:30 PM Euro Zone Euro-Zone CPI (YoY)
%
Mar F
1.50
Apr 20, 2017
7:30 PM Euro Zone Euro-Zone Consumer Confidence
Value
Apr A
(5.00)
Apr 21, 2017
1:00 PM Germany PMI Manufacturing
Value
Apr P
58.30
Source: Bloomberg, Angel Research
Market Outlook
April 6, 2017
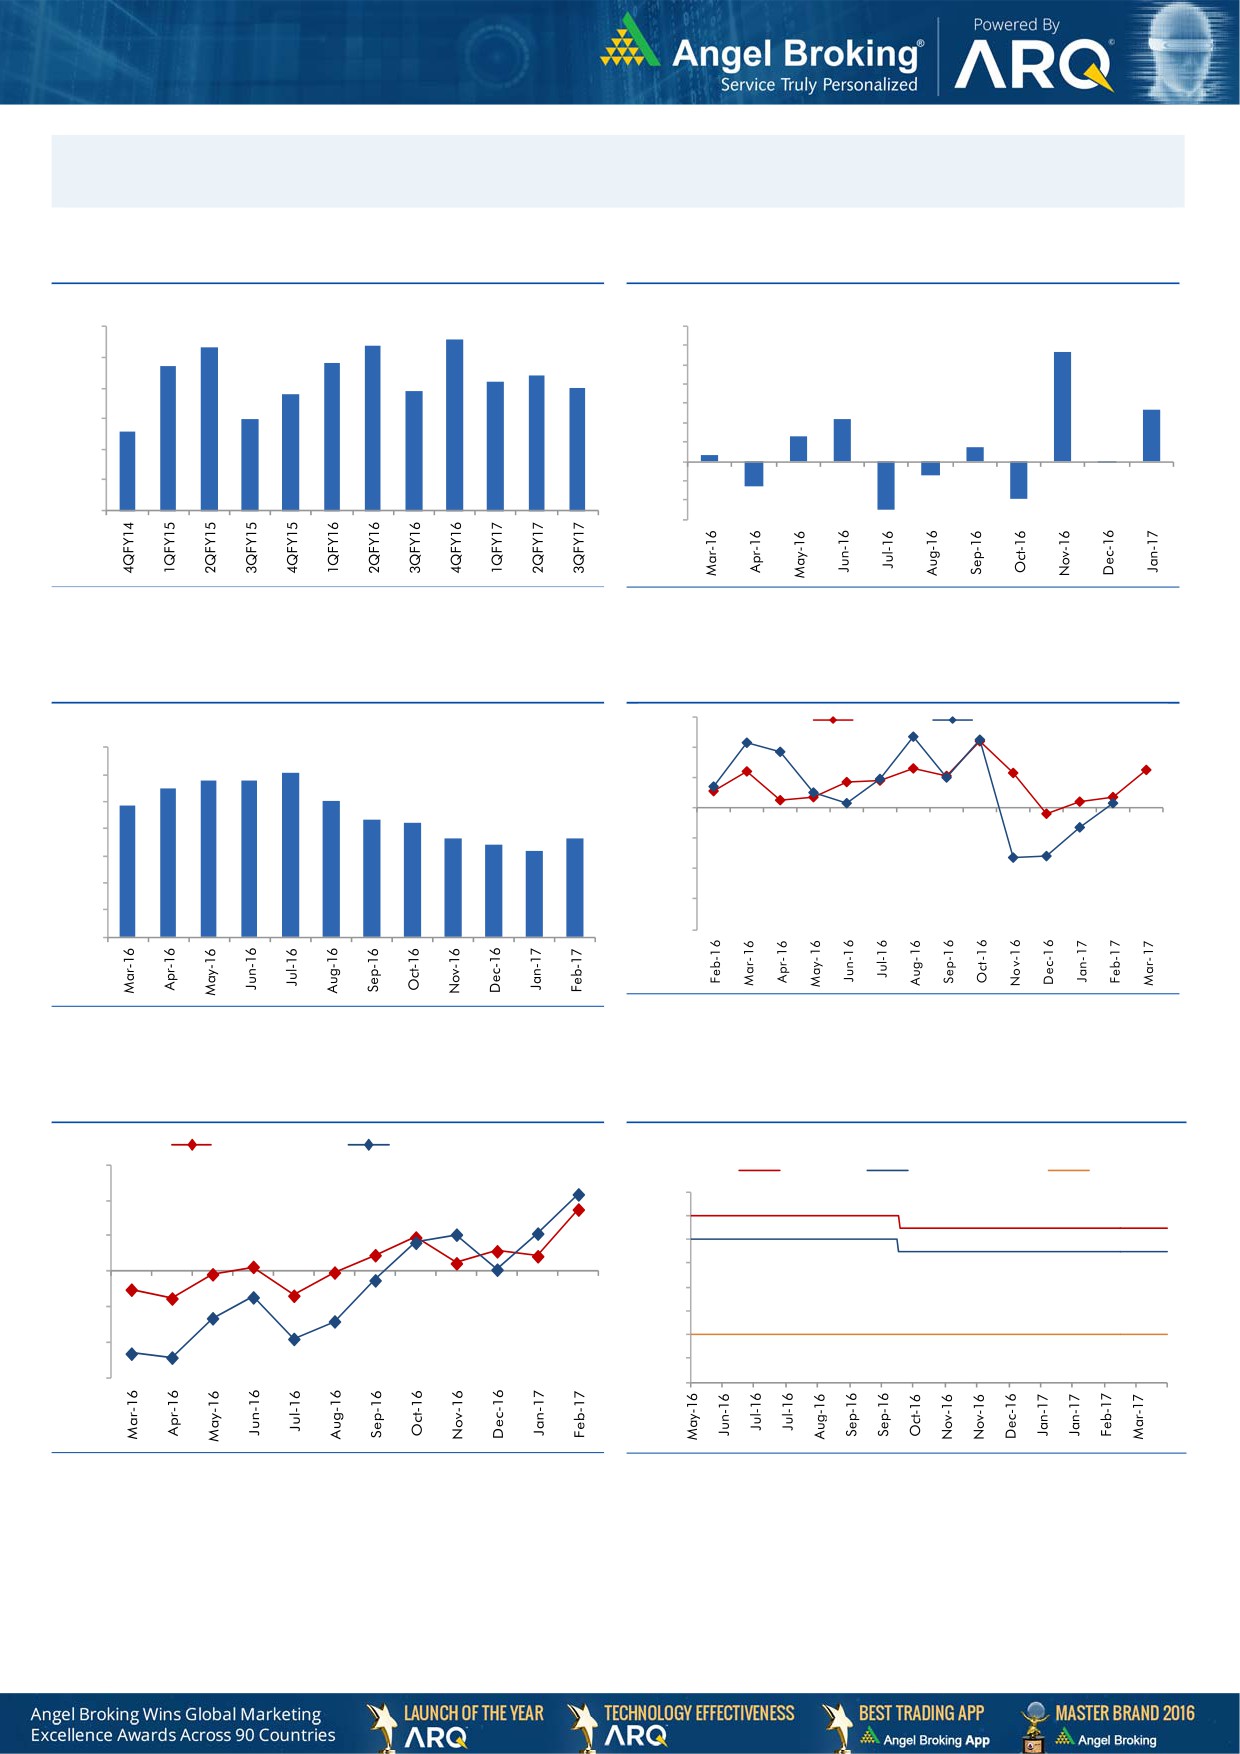
Macro watch
Exhibit 1: Quarterly GDP trends
Exhibit 2: IIP trends
(%)
(%)
8.6
9.0
8.4
7.0
8.3
5.7
7.7
7.8
6.0
8.0
7.4
7.2
5.0
6.9
7.0
6.8
7.0
4.0
2.7
6.0
3.0
2.2
6.0
5.6
1.3
2.0
0.7
1.0
0.3
5.0
-
4.0
(1.0)
(0.1)
(0.7)
(2.0)
3.0
(1.3)
(3.0)
(1.9)
(2.5)
Source: CSO, Angel Research
Source: MOSPI, Angel Research
Exhibit 3: Monthly CPI inflation trends
Exhibit 4: Manufacturing and services PMI
56.0
Mfg. PMI
Services PMI
(%)
7.0
54.0
6.1
5.8
5.8
6.0
5.5
52.0
5.1
4.8
5.0
4.3
4.2
50.0
3.6
3.7
4.0
3.4
3.2
48.0
3.0
46.0
2.0
44.0
1.0
42.0
-
Source: Market, Angel Research; Note: Level above 50 indicates expansion
Source: MOSPI, Angel Research
Exhibit 5: Exports and imports growth trends
Exhibit 6: Key policy rates
(%)
Exports yoy growth
Imports yoy growth
D
30.0
(%)
Repo rate
Reverse Repo rate
CRR
7.00
20.0
6.50
10.0
6.00
5.50
0.0
5.00
(10.0)
4.50
4.00
(20.0)
3.50
(30.0)
3.00
Source: Bloomberg, Angel Research
Source: RBI, Angel Research
Market Outlook
April 6, 2017
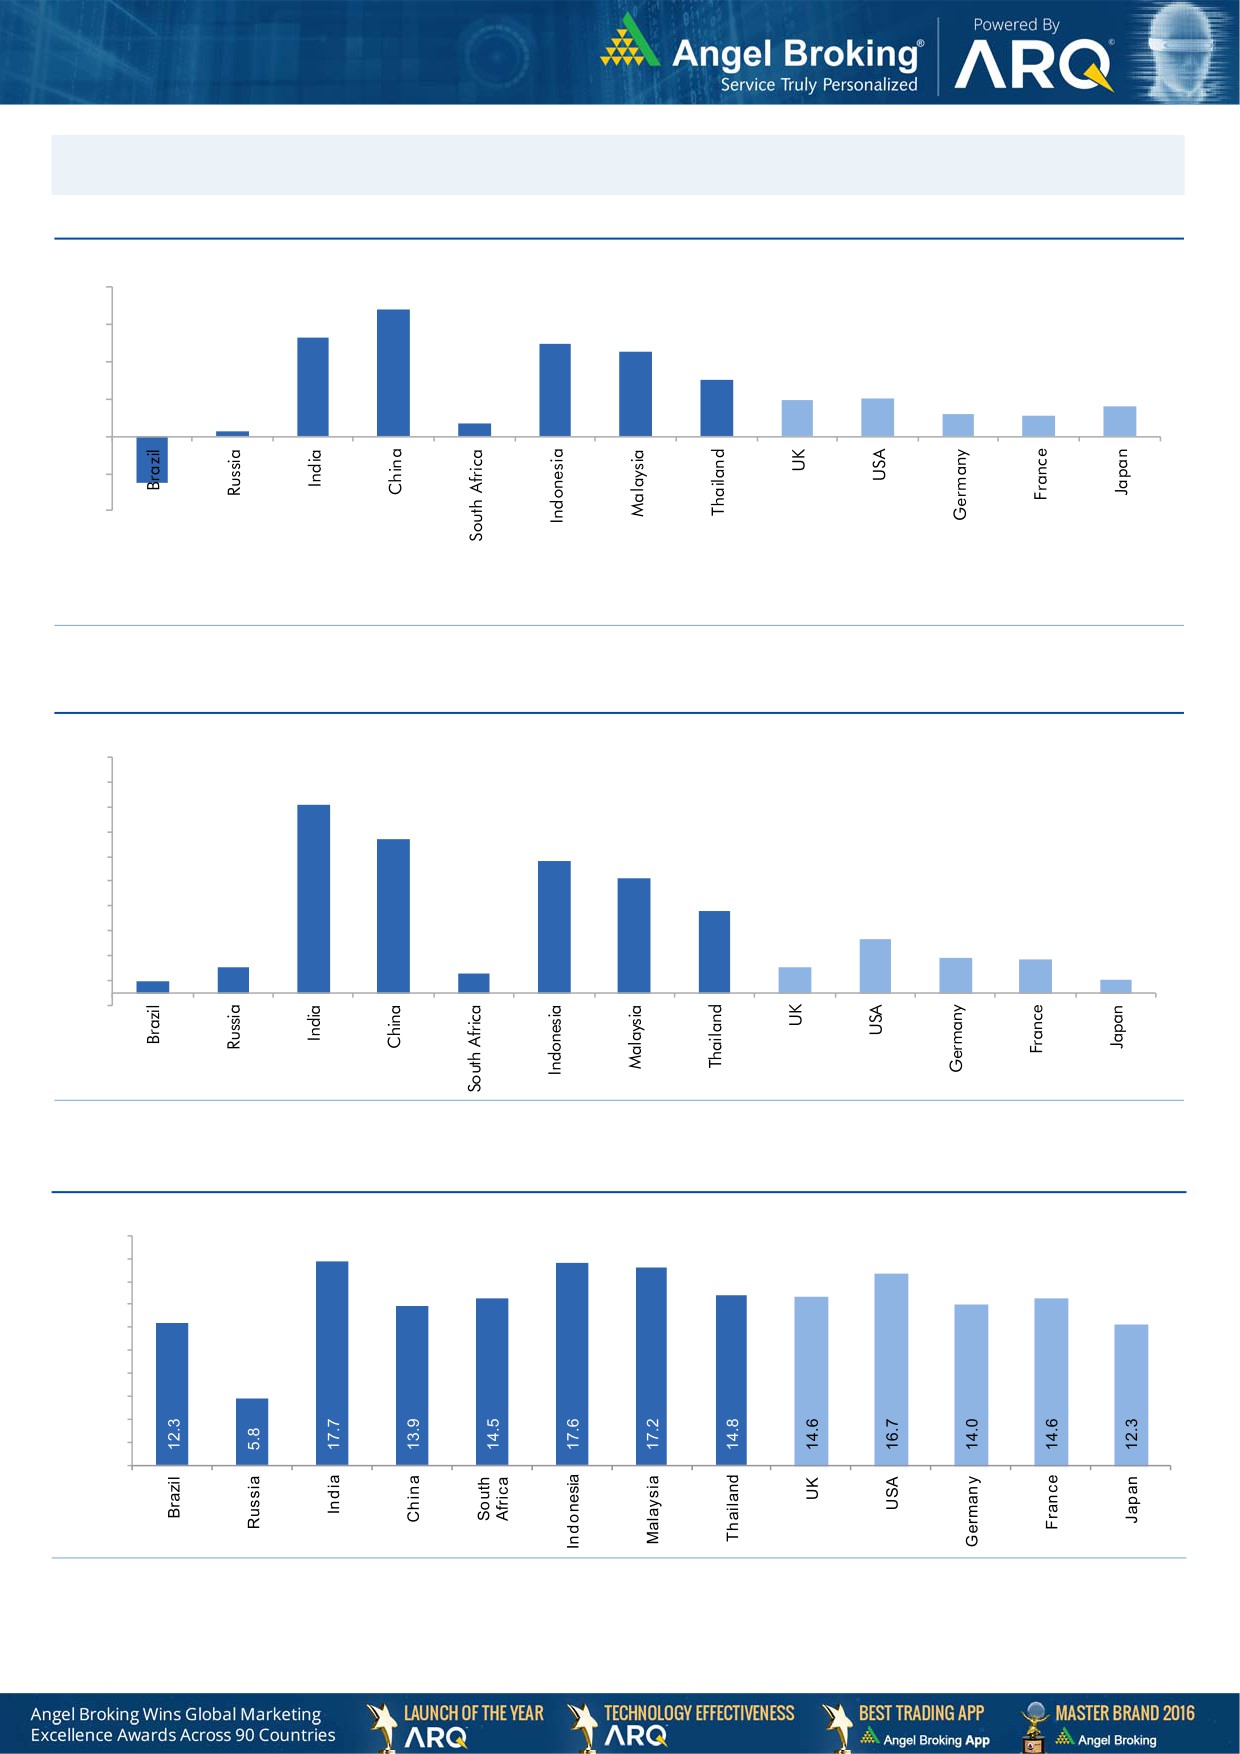
Global watch
Exhibit 1: Latest quarterly GDP Growth (%, yoy) across select developing and developed countries
(%)
8.0
6.8
0.7
5.3
6.0
4.9
4.5
4.0
3.0
0.3
1.9
2.0
1.2
1.6
1.1
2.0
-
(2.0)
(2.5)
(4.0)
Source: Bloomberg, Angel Research
Exhibit 2: 2017 GDP Growth projection by IMF (%, yoy) across select developing and developed countries
(%)
9.5
8.5
7.6
7.5
6.2
6.5
5.3
5.5
4.6
4.5
3.3
3.5
2.2
2.5
1.1
1.4
1.3
1.1
1.5
0.5
0.8
0.6
0.5
(0.5)
Source: IMF, Angel Research
Exhibit 3: One year forward P-E ratio across select developing and developed countries
(x)
20.0
18.0
16.0
14.0
12.0
10.0
8.0
6.0
4.0
2.0
-
Source: IMF, Angel Research
Market Outlook
April 6, 2017
Exhibit 4: Relative performance of indices across globe
Returns (%)
Country
Name of index
Closing price
1M
3M
1YR
Brazil
Bovespa
64,775
(2.4)
8.7
32.0
Russia
Micex
2,056
(0.0)
(10.0)
10.6
India
Nifty
9,265
4.1
13.2
19.8
China
Shanghai Composite
3,270
1.5
4.9
10.4
South Africa
Top 40
46,150
3.4
5.0
2.3
Mexico
Mexbol
49,208
3.8
6.7
9.9
Indonesia
LQ45
944
4.8
5.5
12.0
Malaysia
KLCI
1,745
1.0
6.3
1.6
Thailand
SET 50
1,000
2.5
2.0
10.2
USA
Dow Jones
20,648
(1.5)
3.9
17.7
UK
FTSE
7,332
(0.3)
1.9
18.3
Japan
Nikkei
18,861
(3.1)
(1.3)
10.1
Germany
DAX
12,218
2.2
5.5
21.0
France
CAC
5,092
2.4
3.9
13.0
Source: Bloomberg, Angel Research
Stock Watch
April 06, 2017
Company Name
Reco
CMP
Target
Mkt Cap
Sales ( Čcr )
OPM(%)
EPS (Č)
PER(x)
P/BV(x)
RoE(%)
EV/Sales(x)
(Č)
Price ( Č)
( Č cr )
FY17E
FY18E
FY17E
FY18E
FY17E
FY18E
FY17E
FY18E
FY17E
FY18E
FY17E
FY18E
FY17E
FY18E
6,577.0
6,907.0
Agri / Agri Chemical
Rallis
Neutral
257
-
4,992
1,937
2,164
13.3
14.3
9.0
11.0
28.5
23.3
5.0
4.3
18.4
19.8
2.6
2.3
United Phosphorus
Neutral
732
-
37,104
15,176
17,604
18.5
18.5
37.4
44.6
19.6
16.4
3.8
3.2
21.4
21.2
2.6
2.2
Auto & Auto Ancillary
Ashok Leyland
Buy
85
111
24,176
20,021
21,915
11.6
11.9
4.5
5.3
18.9
16.0
3.8
3.4
20.6
21.5
1.2
1.0
Bajaj Auto
Neutral
2,761
-
79,886
25,093
27,891
19.5
19.2
143.9
162.5
19.2
17.0
5.4
4.6
30.3
29.4
2.9
2.5
Bharat Forge
Neutral
1,074
-
24,993
7,726
8,713
20.5
21.2
35.3
42.7
30.4
25.1
5.6
5.1
18.9
20.1
3.3
2.9
Eicher Motors
Neutral
25,765
-
70,108
16,583
20,447
17.5
18.0
598.0
745.2
43.1
34.6
14.7
11.2
41.2
38.3
4.1
3.2
Gabriel India
Neutral
125
-
1,800
1,544
1,715
9.0
9.3
5.4
6.3
23.2
19.9
4.4
3.9
18.9
19.5
1.1
1.0
Hero Motocorp
Accumulate
3,196
3,446
63,830
28,083
30,096
15.3
15.7
171.8
187.0
18.6
17.1
6.5
5.5
30.1
27.9
2.1
1.9
Jamna Auto Industries Neutral
230
-
1,835
1,486
1,620
9.8
9.9
15.0
17.2
15.4
13.4
3.4
2.8
21.8
21.3
1.3
1.2
L G Balakrishnan & Bros Neutral
633
-
994
1,302
1,432
11.6
11.9
43.7
53.0
14.5
11.9
2.0
1.9
13.8
14.2
0.9
0.8
Mahindra and Mahindra Neutral
1,290
-
80,121
46,534
53,077
11.6
11.7
67.3
78.1
19.2
16.5
3.1
2.7
15.4
15.8
1.7
1.5
Maruti
Neutral
6,339
-
191,501
67,822
83,288
16.0
16.4
253.8
312.4
25.0
20.3
5.7
4.7
23.0
22.9
2.5
2.0
Minda Industries
Neutral
444
-
3,522
2,728
3,042
9.0
9.1
68.2
86.2
6.5
5.2
1.5
1.2
23.8
24.3
1.4
1.2
Motherson Sumi
Neutral
382
-
53,617
45,896
53,687
7.8
8.3
13.0
16.1
29.3
23.7
9.4
7.5
34.7
35.4
1.2
1.0
Rane Brake Lining
Neutral
1,031
-
816
511
562
11.3
11.5
28.1
30.9
36.7
33.3
5.6
5.1
15.3
15.0
1.7
1.6
Setco Automotive
Neutral
39
-
518
741
837
13.0
13.0
15.2
17.0
2.6
2.3
0.4
0.4
15.8
16.3
1.1
1.0
Tata Motors
Neutral
474
-
136,730
300,209
338,549
8.9
8.4
42.7
54.3
11.1
8.7
1.8
1.5
15.6
17.2
0.6
0.5
TVS Motor
Neutral
450
-
21,400
13,390
15,948
6.9
7.1
12.8
16.5
35.3
27.2
8.8
7.0
26.3
27.2
1.6
1.4
Amara Raja Batteries
Accumulate
896
1,009
15,307
5,305
6,100
16.0
16.3
28.4
34.0
31.6
26.4
6.1
5.1
19.3
19.3
2.9
2.5
Exide Industries
Neutral
228
-
19,410
7,439
8,307
15.0
15.0
8.1
9.3
28.2
24.6
3.9
3.5
14.3
16.7
2.2
2.0
Apollo Tyres
Accumulate
212
235
10,784
12,877
14,504
14.3
13.9
21.4
23.0
9.9
9.2
1.5
1.3
16.4
15.2
1.0
0.9
Ceat
Accumulate
1,337
1,450
5,410
7,524
8,624
13.0
12.7
131.1
144.3
10.2
9.3
1.9
1.6
19.8
18.6
0.8
0.7
JK Tyres
Neutral
133
-
3,005
7,455
8,056
15.0
15.0
21.8
24.5
6.1
5.4
1.3
1.0
22.8
21.3
0.5
0.4
Swaraj Engines
Neutral
1,435
-
1,782
660
810
15.2
16.4
54.5
72.8
26.3
19.7
8.2
7.4
31.5
39.2
2.5
2.0
Subros
Neutral
225
-
1,352
1,488
1,681
11.7
11.9
6.4
7.2
35.2
31.5
3.7
3.4
10.8
11.4
1.1
1.0
Indag Rubber
Neutral
212
-
556
286
326
19.8
16.8
11.7
13.3
18.1
15.9
3.1
2.9
17.8
17.1
1.6
1.4
Capital Goods
ACE
Neutral
65
-
639
709
814
4.1
4.6
1.4
2.1
46.1
30.7
1.9
1.8
4.4
6.0
1.1
0.9
Stock Watch
April 06, 2017
Company Name
Reco
CMP
Target
Mkt Cap
Sales ( Čcr )
OPM(%)
EPS (Č)
PER(x)
P/BV(x)
RoE(%)
EV/Sales(x)
(Č)
Price ( Č)
( Č cr )
FY17E
FY18E
FY17E
FY18E
FY17E
FY18E
FY17E
FY18E
FY17E
FY18E
FY17E
FY18E
FY17E
FY18E
Capital Goods
BEML
Neutral
1,363
-
5,675
3,451
4,055
6.3
9.2
31.4
57.9
43.4
23.5
2.6
2.4
6.3
10.9
1.8
1.5
Bharat Electronics
Neutral
161
-
36,040
8,137
9,169
16.8
17.2
58.7
62.5
2.8
2.6
0.4
0.4
44.6
46.3
3.4
3.1
Voltas
Neutral
415
-
13,747
6,511
7,514
7.9
8.7
12.9
16.3
32.2
25.5
5.8
5.1
16.7
18.5
1.9
1.6
BGR Energy
Neutral
150
-
1,082
16,567
33,848
6.0
5.6
7.8
5.9
19.2
25.4
1.1
1.1
4.7
4.2
0.2
0.1
BHEL
Neutral
171
-
41,903
28,797
34,742
-
2.8
2.3
6.9
74.4
24.8
1.3
1.2
1.3
4.8
1.1
0.8
Blue Star
Accumulate
695
760
6,646
4,283
5,077
5.9
7.3
14.9
22.1
46.7
31.4
9.1
7.6
20.4
26.4
1.6
1.3
CG Power and Industrial
Neutral
81
-
5,048
5,777
6,120
5.9
7.0
3.3
4.5
24.4
17.9
1.1
1.0
4.4
5.9
0.8
0.7
Solutions
Greaves Cotton
Neutral
172
-
4,210
1,755
1,881
16.8
16.9
7.8
8.5
22.1
20.3
4.4
4.1
20.6
20.9
2.1
1.9
Inox Wind
Neutral
183
-
4,067
5,605
6,267
15.7
16.4
24.8
30.0
7.4
6.1
2.1
1.5
25.9
24.4
0.8
0.6
KEC International
Neutral
219
-
5,639
9,294
10,186
7.9
8.1
9.9
11.9
22.2
18.4
3.2
2.8
15.6
16.3
0.8
0.8
KEI Industries
Accumulate
195
207
1,517
2,682
3,058
10.4
10.0
11.7
12.8
16.6
15.2
3.3
2.8
20.1
18.2
0.8
0.7
Thermax
Neutral
987
-
11,764
5,421
5,940
7.3
7.3
25.7
30.2
38.4
32.7
4.6
4.3
12.2
13.1
2.1
1.9
VATech Wabag
Neutral
698
-
3,808
3,136
3,845
8.9
9.1
26.0
35.9
26.8
19.4
3.4
2.9
13.4
15.9
1.1
0.9
Cement
ACC
Neutral
1,467
-
27,540
11,225
13,172
13.2
16.9
44.5
75.5
33.0
19.4
3.1
2.9
11.2
14.2
2.5
2.1
Ambuja Cements
Neutral
239
-
47,387
9,350
10,979
18.2
22.5
5.8
9.5
41.2
25.1
3.5
3.1
10.2
12.5
5.1
4.3
India Cements
Neutral
163
-
5,004
4,364
4,997
18.5
19.2
7.9
11.3
20.6
14.4
1.5
1.4
8.0
8.5
1.9
1.7
JK Cement
Neutral
935
-
6,538
4,398
5,173
15.5
17.5
31.2
55.5
30.0
16.9
3.6
3.1
12.0
15.5
2.0
1.7
J K Lakshmi Cement
Neutral
458
-
5,387
2,913
3,412
14.5
19.5
7.5
22.5
61.0
20.4
3.8
3.2
12.5
18.0
2.4
2.0
Orient Cement
Neutral
146
-
2,985
2,114
2,558
18.5
20.5
8.1
11.3
18.0
12.9
2.7
2.2
9.0
14.0
2.0
1.6
UltraTech Cement
Neutral
4,071
-
111,737
25,768
30,385
21.0
23.5
111.0
160.0
36.7
25.4
4.7
4.1
13.5
15.8
4.4
3.7
Construction
ITNL
Neutral
113
-
3,712
8,946
10,017
31.0
31.6
8.1
9.1
13.9
12.4
0.5
0.5
4.2
5.0
3.7
3.5
KNR Constructions
Neutral
202
-
2,836
1,385
1,673
14.7
14.0
41.2
48.5
4.9
4.2
0.9
0.8
14.9
15.2
2.1
1.8
Larsen & Toubro
Neutral
1,697
-
158,310
111,017
124,908
11.0
11.0
61.1
66.7
27.8
25.4
3.3
3.1
13.1
12.9
2.5
2.3
Gujarat Pipavav Port
Neutral
172
-
8,298
705
788
52.2
51.7
5.0
5.6
34.3
30.7
3.4
3.0
11.2
11.2
11.4
9.7
Nagarjuna Const.
Neutral
87
-
4,845
8,842
9,775
9.1
8.8
5.3
6.4
16.4
13.6
1.3
1.2
8.2
9.1
0.7
0.6
PNC Infratech
Accumulate
128
143
3,275
2,350
2,904
13.1
13.2
9.0
8.8
14.2
14.5
0.5
0.5
15.9
13.9
1.5
1.2
Simplex Infra
Neutral
318
-
1,575
6,829
7,954
10.5
10.5
31.4
37.4
10.1
8.5
1.1
1.0
9.9
13.4
0.7
0.6
Power Mech Projects
Neutral
550
-
809
1,801
2,219
12.7
14.6
72.1
113.9
7.6
4.8
1.4
1.2
16.8
11.9
0.5
0.3
Sadbhav Engineering
Neutral
309
-
5,295
3,598
4,140
10.3
10.6
9.0
11.9
34.3
25.9
3.6
3.2
9.9
11.9
1.8
1.5
Stock Watch
April 06, 2017
Company Name
Reco
CMP
Target
Mkt Cap
Sales ( Čcr )
OPM(%)
EPS (Č)
PER(x)
P/BV(x)
RoE(%)
EV/Sales(x)
(Č)
Price ( Č)
( Č cr )
FY17E
FY18E
FY17E
FY18E
FY17E
FY18E
FY17E
FY18E
FY17E
FY18E
FY17E
FY18E
FY17E
FY18E
Construction
NBCC
Neutral
172
-
15,471
7,428
9,549
7.9
8.6
8.2
11.0
21.0
15.6
1.0
0.8
28.2
28.7
1.8
1.3
MEP Infra
Neutral
59
-
962
1,877
1,943
30.6
29.8
3.0
4.2
19.7
14.1
9.5
6.4
0.6
0.6
1.9
1.7
SIPL
Neutral
99
-
3,496
1,036
1,252
65.5
66.2
(8.4)
(5.6)
3.7
4.2
(22.8)
(15.9)
11.6
9.6
Engineers India
Neutral
151
-
10,149
1,725
1,935
16.0
19.1
11.4
13.9
13.2
10.8
1.8
1.8
13.4
15.3
4.8
4.3
Financials
Axis Bank
Accumulate
507
580
121,266
46,932
53,575
3.5
3.4
32.4
44.6
15.7
11.4
2.0
1.8
13.6
16.5
-
-
Bank of Baroda
Neutral
174
-
40,173
19,980
23,178
1.8
1.8
11.5
17.3
15.2
10.1
1.7
1.4
8.3
10.1
-
-
Canara Bank
Neutral
311
-
16,865
15,225
16,836
1.8
1.8
14.5
28.0
21.4
11.1
1.5
1.2
5.8
8.5
-
-
Can Fin Homes
Neutral
2,333
-
6,210
420
526
3.5
3.5
86.5
107.8
27.0
21.6
5.8
4.8
23.6
24.1
-
-
Cholamandalam Inv. &
Buy
979
1,230
15,298
2,012
2,317
6.3
6.3
42.7
53.6
22.9
18.3
3.6
3.1
16.9
18.3
-
-
Fin. Co.
Dewan Housing Finance Neutral
385
-
12,050
2,225
2,688
2.9
2.9
29.7
34.6
13.0
11.1
2.1
1.8
16.1
16.8
-
-
Equitas Holdings
Buy
170
235
5,738
939
1,281
11.7
11.5
5.8
8.2
29.3
20.7
2.5
2.3
10.9
11.5
-
-
Federal Bank
Neutral
91
-
15,671
8,259
8,995
3.0
3.0
4.3
5.6
21.2
16.2
1.8
1.7
8.5
10.1
-
-
HDFC
Neutral
1,490
-
236,664
11,475
13,450
3.4
3.4
45.3
52.5
32.9
28.4
6.3
5.6
20.2
20.5
-
-
HDFC Bank
Neutral
1,433
-
367,315
46,097
55,433
4.5
4.5
58.4
68.0
24.5
21.1
4.3
3.6
18.8
18.6
-
-
ICICI Bank
Accumulate
285
315
165,908
42,800
44,686
3.1
3.3
18.0
21.9
15.8
13.0
2.1
2.0
11.1
12.3
-
-
Lakshmi Vilas Bank
Neutral
172
-
3,290
3,339
3,799
2.7
2.8
11.0
14.0
15.6
12.3
1.6
1.5
11.2
12.7
-
-
LIC Housing Finance
Neutral
624
-
31,501
3,712
4,293
2.6
2.5
39.0
46.0
16.0
13.6
3.0
2.6
19.9
20.1
-
-
Punjab Natl.Bank
Neutral
151
-
32,164
23,532
23,595
2.3
2.4
6.8
12.6
22.2
12.0
3.4
2.4
3.3
6.5
-
-
RBL Bank
Neutral
534
-
19,744
1,783
2,309
2.6
2.6
12.7
16.4
42.0
32.6
4.6
4.1
12.8
13.3
-
-
Repco Home Finance
Buy
720
825
4,503
388
457
4.5
4.2
30.0
38.0
24.0
18.9
4.0
3.4
18.0
19.2
-
-
South Ind.Bank
Neutral
22
-
3,885
6,435
7,578
2.5
2.5
2.7
3.1
8.0
7.0
1.0
0.9
10.1
11.2
-
-
St Bk of India
Neutral
297
-
236,574
88,650
98,335
2.6
2.6
13.5
18.8
22.0
15.8
2.1
1.8
7.0
8.5
-
-
Union Bank
Neutral
158
-
10,855
13,450
14,925
2.3
2.3
25.5
34.5
6.2
4.6
0.9
0.8
7.5
10.2
-
-
Yes Bank
Neutral
1,567
-
71,527
8,978
11,281
3.3
3.4
74.0
90.0
21.2
17.4
4.0
3.4
17.0
17.2
-
-
FMCG
Akzo Nobel India
Neutral
1,931
-
9,260
2,955
3,309
13.3
13.7
57.2
69.3
33.8
27.9
11.0
9.3
32.7
33.3
2.9
2.6
Asian Paints
Neutral
1,080
-
103,637
17,128
18,978
16.8
16.4
19.1
20.7
56.6
52.2
19.7
18.6
34.8
35.5
6.0
5.4
Britannia
Accumulate
3,372
3,626
40,458
9,594
11,011
14.6
14.9
80.3
94.0
42.0
35.9
17.3
13.3
41.2
-
4.1
3.5
Colgate
Neutral
1,001
-
27,219
4,605
5,149
23.4
23.4
23.8
26.9
42.1
37.2
23.3
18.2
64.8
66.8
5.8
5.2
Dabur India
Accumulate
284
304
49,974
8,315
9,405
19.8
20.7
8.1
9.2
35.0
30.8
9.8
8.1
31.6
31.0
5.7
5.0
Stock Watch
April 06, 2017
Company Name
Reco
CMP
Target
Mkt Cap
Sales ( Čcr )
OPM(%)
EPS (Č)
PER(x)
P/BV(x)
RoE(%)
EV/Sales(x)
(Č)
Price ( Č)
( Č cr )
FY17E FY18E
FY17E
FY18E
FY17E
FY18E
FY17E
FY18E
FY17E
FY18E
FY17E
FY18E
FY17E
FY18E
FMCG
GlaxoSmith Con*
Neutral
5,181
-
21,788
4,350
4,823
21.2
21.4
179.2
196.5
28.9
26.4
7.7
6.5
27.1
26.8
4.4
3.9
Godrej Consumer
Neutral
1,701
-
57,948
10,235
11,428
18.4
18.6
41.1
44.2
41.4
38.5
9.2
7.8
24.9
24.8
5.7
5.1
HUL
Neutral
935
-
202,432
35,252
38,495
17.8
17.8
20.7
22.4
45.3
41.8
43.3
37.1
95.6
88.9
5.6
5.1
ITC
Neutral
279
-
338,851
40,059
44,439
38.3
39.2
9.0
10.1
31.1
27.5
8.7
7.6
27.8
27.5
8.0
7.2
Marico
Neutral
298
-
38,460
6,430
7,349
18.8
19.5
6.4
7.7
46.6
38.7
14.1
11.8
33.2
32.5
5.8
5.0
Nestle*
Neutral
6,622
-
63,847
10,073
11,807
20.7
21.5
124.8
154.2
53.1
42.9
21.8
19.6
34.8
36.7
6.2
5.2
Tata Global
Neutral
153
-
9,634
8,675
9,088
9.8
9.8
7.4
8.2
20.6
18.6
1.6
1.6
7.9
8.1
1.0
1.0
Procter & Gamble
Neutral
7,415
-
24,068
2,939
3,342
23.2
23.0
146.2
163.7
50.7
45.3
12.8
10.7
25.3
23.5
7.7
6.7
Hygiene
IT
HCL Tech^
Buy
853
1,000
120,377
49,242
57,168
20.5
20.5
55.7
64.1
15.3
13.3
3.1
2.4
20.3
17.9
2.3
1.9
Infosys
Buy
995
1,249
228,638
68,350
77,326
27.0
27.0
62.5
69.4
15.9
14.3
3.4
3.1
21.3
21.6
2.8
2.4
TCS
Accumulate
2,403
2,700
473,464
119,025
133,308
27.6
27.6
131.2
145.5
18.3
16.5
5.9
5.5
32.4
33.1
3.8
3.3
Tech Mahindra
Buy
447
600
43,503
29,673
32,937
15.5
17.0
32.8
39.9
13.6
11.2
2.7
2.3
19.6
20.7
1.2
1.0
Wipro
Accumulate
511
583
124,109
55,440
60,430
18.1
18.1
36.1
38.9
14.1
13.1
2.5
2.3
19.0
17.6
2.0
1.7
Media
D B Corp
Neutral
391
-
7,184
2,297
2,590
27.4
28.2
21.0
23.4
18.6
16.7
4.3
3.8
23.7
23.1
2.9
2.5
HT Media
Neutral
85
-
1,985
2,693
2,991
12.6
12.9
7.9
9.0
10.8
9.5
0.9
0.8
7.8
8.3
0.3
0.2
Jagran Prakashan
Buy
185
225
6,033
2,355
2,635
28.0
28.0
10.8
12.5
17.1
14.8
3.7
3.2
21.7
21.7
2.6
2.3
Sun TV Network
Neutral
796
-
31,365
2,850
3,265
70.1
71.0
26.2
30.4
30.4
26.2
7.8
6.9
24.3
25.6
10.6
9.1
Hindustan Media
Neutral
288
-
2,115
1,016
1,138
24.3
25.2
27.3
30.1
10.6
9.6
2.0
1.8
16.2
15.8
1.4
1.2
Ventures
TV Today Network
Buy
277
344
1,654
567
645
26.7
27.0
15.4
18.1
18.0
15.3
2.7
2.3
14.9
15.2
2.5
2.1
Metals & Mining
Coal India
Neutral
290
-
180,015
84,638
94,297
21.4
22.3
24.5
27.1
11.8
10.7
4.9
4.7
42.6
46.0
1.6
1.5
Hind. Zinc
Neutral
291
-
123,126
14,252
18,465
55.9
48.3
15.8
21.5
18.4
13.6
3.0
2.6
17.0
20.7
8.6
6.7
Hindalco
Neutral
198
-
44,461
107,899
112,095
7.4
8.2
9.2
13.0
21.5
15.3
1.0
1.0
4.8
6.6
0.9
0.9
JSW Steel
Neutral
195
-
47,220
53,201
58,779
16.1
16.2
130.6
153.7
1.5
1.3
0.2
0.2
14.0
14.4
1.6
1.4
NMDC
Neutral
136
-
43,045
6,643
7,284
44.4
47.7
7.1
7.7
19.2
17.7
1.7
1.6
8.8
9.2
4.2
3.8
SAIL
Neutral
65
-
27,031
47,528
53,738
(0.7)
2.1
(1.9)
2.6
25.2
0.7
0.7
(1.6)
3.9
1.4
1.3
Vedanta
Neutral
273
-
80,832
71,744
81,944
19.2
21.7
13.4
20.1
20.4
13.6
1.7
1.6
8.4
11.3
1.5
1.2
Tata Steel
Neutral
493
-
47,915
121,374
121,856
7.2
8.4
18.6
34.3
26.5
14.4
1.7
1.5
6.1
10.1
1.0
1.0
Oil & Gas
Cairn India
Neutral
303
-
56,858
9,127
10,632
4.3
20.6
8.8
11.7
34.4
25.9
1.1
1.1
3.3
4.2
7.7
6.4
GAIL
Neutral
383
-
64,692
56,220
65,198
9.3
10.1
27.1
33.3
14.1
11.5
1.3
1.2
9.3
10.7
1.3
1.1
Stock Watch
April 06, 2017
Company Name
Reco
CMP
Target
Mkt Cap
Sales ( Čcr )
OPM(%)
EPS (Č)
PER(x)
P/BV(x)
RoE(%)
EV/Sales(x)
(Č)
Price ( Č)
( Č cr )
FY17E FY18E
FY17E
FY18E
FY17E
FY18E
FY17E
FY18E
FY17E
FY18E
FY17E
FY18E
FY17E
FY18E
Oil & Gas
ONGC
Neutral
186
-
239,019
137,222
152,563
15.0
21.8
19.5
24.1
9.6
7.7
0.8
0.8
8.5
10.1
2.0
1.8
Indian Oil Corp
Neutral
381
-
185,180
373,359
428,656
5.9
5.5
54.0
59.3
7.1
6.4
1.1
1.0
16.0
15.6
0.7
0.6
Reliance Industries
Neutral
1,415
-
460,023
301,963
358,039
12.1
12.6
87.7
101.7
16.1
13.9
1.7
1.5
10.7
11.3
2.0
1.7
Pharmaceuticals
Alembic Pharma
Accumulate
625
689
11,786
3,483
4,244
20.2
21.4
24.3
33.6
25.7
18.6
5.9
4.7
25.5
25.3
3.3
2.6
Alkem Laboratories Ltd
Neutral
2,208
-
26,399
6,065
7,009
18.7
20.0
80.2
92.0
27.5
24.0
6.2
5.2
22.5
21.6
4.3
3.7
Aurobindo Pharma
Buy
678
877
39,710
15,720
18,078
23.7
23.7
41.4
47.3
16.4
14.3
4.3
3.3
29.6
26.1
2.7
2.4
Aventis*
Neutral
4,755
-
10,951
2,277
2,597
16.6
17.4
128.9
157.0
36.9
30.3
6.3
4.8
21.6
26.4
4.6
3.8
Cadila Healthcare
Neutral
449
-
45,925
10,429
12,318
17.7
21.6
13.1
19.2
34.2
23.4
7.2
5.7
22.8
27.1
4.4
3.7
Cipla
Sell
593
465
47,679
15,378
18,089
15.7
16.8
19.3
24.5
30.7
24.2
3.6
3.2
12.3
13.9
3.3
2.7
Dr Reddy's
Neutral
2,736
-
45,331
16,043
18,119
18.0
23.0
78.6
130.9
34.8
20.9
3.4
3.0
10.1
15.2
2.6
2.5
Dishman Pharma
Sell
333
143
5,378
1,718
1,890
22.7
22.8
9.5
11.3
35.1
29.5
3.4
3.1
10.1
10.9
3.6
3.2
GSK Pharma*
Neutral
2,738
-
23,195
2,800
3,290
10.2
20.6
32.2
60.3
85.0
45.4
15.7
15.6
17.2
34.5
8.1
6.9
Indoco Remedies
Neutral
243
-
2,242
1,112
1,289
16.2
18.2
11.6
16.0
21.0
15.2
3.4
2.8
17.0
20.1
2.1
1.8
Ipca labs
Neutral
647
-
8,165
3,258
3,747
12.8
15.3
12.1
19.2
53.5
33.7
3.3
3.1
6.4
9.5
2.6
2.3
Lupin
Buy
1,453
1,809
65,610
15,912
18,644
26.4
26.7
58.1
69.3
25.0
21.0
4.9
4.0
21.4
20.9
4.2
3.5
Sun Pharma
Buy
691
847
165,715
31,129
35,258
32.0
32.9
30.2
35.3
22.9
19.6
3.7
3.1
20.0
20.1
4.9
4.1
Power
Tata Power
Neutral
88
-
23,856
36,916
39,557
17.4
27.1
5.1
6.3
17.3
14.0
1.5
1.4
9.0
10.3
1.7
1.5
NTPC
Neutral
166
-
137,205
86,605
95,545
17.5
20.8
11.8
13.4
14.1
12.4
1.4
1.3
10.5
11.1
2.9
2.9
Power Grid
Accumulate
195
223
101,885
25,315
29,193
88.2
88.7
14.2
17.2
13.8
11.4
2.1
1.8
15.2
16.1
8.7
7.8
Real Estate
Prestige Estate
Neutral
224
-
8,383
4,707
5,105
25.2
26.0
10.3
13.0
21.7
17.2
1.7
1.6
10.3
10.2
3.0
2.6
MLIFE
Buy
404
522
1,657
1,152
1,300
22.7
24.6
29.9
35.8
13.5
11.3
1.0
0.9
7.6
8.6
2.2
1.8
Telecom
Bharti Airtel
Neutral
345
-
137,750
105,086
114,808
34.5
34.7
12.2
16.4
28.3
21.0
1.9
1.8
6.8
8.4
2.2
1.9
Idea Cellular
Neutral
88
-
31,601
40,133
43,731
37.2
37.1
6.4
6.5
13.7
13.5
1.1
1.1
8.2
7.6
1.8
1.5
zOthers
Abbott India
Neutral
4,771
-
10,138
3,153
3,583
14.1
14.4
152.2
182.7
31.4
26.1
153.9
131.4
25.6
26.1
2.9
2.5
Asian Granito
Accumulate
370
390
1,112
1,060
1,169
12.2
12.5
12.7
15.9
29.2
23.3
2.8
2.5
9.5
10.7
1.4
1.2
Bajaj Electricals
Accumulate
348
395
3,525
4,801
5,351
5.7
6.2
10.4
13.7
33.4
25.4
4.1
3.7
12.4
14.5
0.7
0.7
Banco Products (India)
Neutral
227
-
1,626
1,353
1,471
12.3
12.4
14.5
16.3
15.7
14.0
21.7
19.5
14.5
14.6
1.1
122.8
Coffee Day Enterprises
Neutral
233
-
4,799
2,964
3,260
20.5
21.2
4.7
8.0
-
29.1
2.7
2.5
5.5
8.5
2.0
1.8
Ltd
Competent Automobiles Neutral
190
-
117
1,137
1,256
3.1
2.7
28.0
23.6
6.8
8.1
36.5
33.0
14.3
11.5
0.1
0.1
Stock Watch
April 06, 2017
Company Name
Reco
CMP
Target
Mkt Cap
Sales ( Čcr )
OPM(%)
EPS (Č)
PER(x)
P/BV(x)
RoE(%)
EV/Sales(x)
(Č)
Price ( Č)
( Č cr )
FY17E
FY18E
FY17E
FY18E
FY17E
FY18E
FY17E
FY18E
FY17E
FY18E
FY17E
FY18E
FY17E
FY18E
zOthers
Elecon Engineering
Neutral
58
-
648
1,482
1,660
13.7
14.5
3.9
5.8
14.8
10.0
3.5
3.2
7.8
10.9
0.8
0.7
Finolex Cables
Neutral
546
-
8,350
2,883
3,115
12.0
12.1
14.2
18.6
38.5
29.4
20.5
17.9
15.8
14.6
2.6
2.3
Garware Wall Ropes
Neutral
730
-
1,597
863
928
15.1
15.2
36.4
39.4
20.1
18.5
3.6
3.1
17.5
15.9
1.8
1.6
Goodyear India*
Neutral
876
-
2,021
1,598
1,704
10.4
10.2
49.4
52.6
17.7
16.7
81.9
71.8
18.2
17.0
1.0
135.4
Hitachi
Neutral
1,820
-
4,947
2,081
2,433
8.8
8.9
33.4
39.9
54.5
45.6
44.0
36.6
22.1
21.4
2.4
2.0
HSIL
Neutral
349
-
2,524
2,384
2,515
15.8
16.3
15.3
19.4
22.8
18.0
22.7
19.5
7.8
9.3
1.2
1.1
Interglobe Aviation
Neutral
1,044
-
37,746
21,122
26,005
14.5
27.6
110.7
132.1
9.4
7.9
56.5
40.3
168.5
201.1
1.8
1.4
Jyothy Laboratories
Neutral
342
-
6,205
1,440
2,052
11.5
13.0
8.5
10.0
40.2
34.2
9.7
9.0
18.6
19.3
4.6
3.2
Kirloskar Engines India
Neutral
390
-
5,633
2,554
2,800
9.9
10.0
10.5
12.1
37.1
32.2
15.5
14.6
10.7
11.7
1.8
1.6
Ltd
Linc Pen & Plastics
Neutral
293
-
433
382
420
9.3
9.5
13.5
15.7
21.7
18.6
3.7
3.2
17.1
17.3
1.2
1.1
M M Forgings
Neutral
555
-
670
546
608
20.4
20.7
41.3
48.7
13.5
11.4
76.0
67.3
16.6
17.0
1.1
1.0
Manpasand Bever.
Neutral
714
-
4,085
836
1,087
19.6
19.4
16.9
23.8
42.3
30.0
5.1
4.4
12.0
14.8
4.6
3.5
Mirza International
Buy
89
107
1,072
963
1,069
17.2
18.0
6.1
7.5
14.5
11.9
2.2
1.9
15.0
15.7
1.3
1.2
MT Educare
Neutral
87
-
345
366
417
17.7
18.2
9.4
10.8
9.2
8.0
2.1
1.8
22.2
22.3
0.8
0.7
Narayana Hrudaya
Neutral
321
-
6,569
1,873
2,166
11.5
11.7
2.6
4.0
121.5
81.1
7.5
6.7
6.1
8.3
3.6
3.1
Navkar Corporation
Buy
181
265
2,581
369
561
42.9
42.3
6.9
11.5
26.2
15.7
1.8
1.7
7.4
10.5
8.0
5.3
Navneet Education
Neutral
168
-
3,913
1,062
1,147
24.0
24.0
6.1
6.6
27.5
25.3
5.7
5.0
20.6
19.8
3.8
3.5
Nilkamal
Neutral
2,085
-
3,112
1,995
2,165
10.7
10.4
69.8
80.6
29.9
25.9
119.2
103.5
16.6
16.5
1.6
1.4
Page Industries
Neutral
14,596
-
16,280
2,450
3,124
20.1
17.6
299.0
310.0
48.8
47.1
325.1
248.2
47.1
87.5
6.7
5.3
Parag Milk Foods
Neutral
242
-
2,039
1,919
2,231
9.3
9.6
9.5
12.9
25.7
18.7
4.0
3.3
15.5
17.5
1.2
1.0
Quick Heal
Neutral
251
-
1,756
408
495
27.3
27.0
7.7
8.8
32.4
28.5
3.0
3.0
9.3
10.6
3.4
2.9
Radico Khaitan
Accumulate
130
147
1,726
1,667
1,824
13.0
13.2
6.7
8.2
19.5
15.9
1.8
1.6
9.0
10.2
1.4
1.3
Relaxo Footwears
Neutral
497
-
5,965
2,085
2,469
9.2
8.2
7.6
8.0
65.7
62.5
25.5
21.7
17.9
18.8
3.0
2.5
S H Kelkar & Co.
Neutral
298
-
4,304
1,036
1,160
15.1
15.0
6.1
7.2
48.7
41.5
5.2
4.8
10.7
11.5
4.0
3.6
Siyaram Silk Mills
Accumulate
1,700
1,872
1,594
1,652
1,857
11.6
11.7
92.4
110.1
18.4
15.4
2.7
2.4
14.7
15.2
1.2
1.0
Styrolution ABS India*
Neutral
713
-
1,253
1,440
1,537
9.2
9.0
40.6
42.6
17.6
16.7
44.8
40.7
12.3
11.6
0.8
0.7
Surya Roshni
Neutral
213
-
932
3,342
3,625
7.8
7.5
17.3
19.8
12.3
10.8
23.4
18.8
10.5
10.8
0.5
0.5
Team Lease Serv.
Neutral
1,004
-
1,717
3,229
4,001
1.5
1.8
22.8
32.8
44.1
30.6
4.7
4.1
10.7
13.4
0.4
0.3
The Byke Hospitality
Neutral
184
-
737
287
384
20.5
20.5
7.6
10.7
24.2
17.2
5.1
4.1
20.7
23.5
2.6
1.9
Stock Watch
April 06, 2017
Company Name
Reco
CMP
Target Mkt Cap
Sales ( Čcr )
OPM(%)
EPS (Č)
PER(x)
P/BV(x)
RoE(%)
EV/Sales(x)
(Č)
Price ( Č)
( Č cr )
FY17E FY18E FY17E FY18E FY17E FY18E FY17E FY18E FY17E FY18E FY17E FY18E FY17E FY18E
zOthers
Transport Corporation of
Neutral
239
-
1,827
2,671
2,911
8.5
8.8
13.9
15.7
17.2
15.2
2.4
2.1
13.7
13.8
0.8
0.7
India
TVS Srichakra
Neutral
3,522
-
2,697
2,304
2,614
13.7
13.8
231.1
266.6
15.2
13.2
395.7
311.6
33.9
29.3
1.2
1.0
UFO Moviez
Neutral
443
-
1,222
619
685
33.2
33.4
30.0
34.9
14.8
12.7
2.0
1.8
13.8
13.9
1.7
1.3
Visaka Industries
Neutral
324
-
514
1,051
1,138
10.3
10.4
21.0
23.1
15.4
14.0
41.5
38.9
9.0
9.2
0.8
0.7
VRL Logistics
Neutral
343
-
3,126
1,902
2,119
16.7
16.6
14.6
16.8
23.5
20.4
5.2
4.5
21.9
22.2
1.8
1.5
VIP Industries
Neutral
215
-
3,045
1,270
1,450
10.4
10.4
5.6
6.5
38.5
33.2
8.0
7.0
20.7
21.1
2.4
2.1
Navin Fluorine
Accumulate
3,182
3,650
3,116
789
945
21.1
22.4
120.1
143.4
26.5
22.2
4.3
3.7
17.8
18.5
3.9
3.2
Source: Company, Angel Research; Note: *December year end; #September year end; &October year end; Price as on April 05, 2017
Market Outlook
April 06, 2017
Research Team Tel: 022 - 39357800
DISCLAIMER
Angel Broking Private Limited (hereinafter referred to as “Angel”) is a registered Member of National Stock Exchange of India
Limited,Bombay Stock Exchange Limited and Metropolitan Stock Exchange Limited. It is also registered as a Depository Participant with
CDSL and Portfolio Manager with SEBI. It also has registration with AMFI as a Mutual Fund Distributor. Angel Broking Private Limited is a
registered entity with SEBI for Research Analyst in terms of SEBI (Research Analyst) Regulations, 2014 vide registration number
INH000000164. Angel or its associates has not been debarred/ suspended by SEBI or any other regulatory authority for accessing
/dealing in securities Market. Angel or its associates/analyst has not received any compensation / managed or
co-managed public offering of securities of the company covered by Analyst during the past twelve months.
This document is solely for the personal information of the recipient, and must not be singularly used as the basis of any investment
decision. Nothing in this document should be construed as investment or financial advice. Each recipient of this document should make
such investigations as they deem necessary to arrive at an independent evaluation of an investment in the securities of the companies
referred to in this document (including the merits and risks involved), and should consult their own advisors to determine the merits and
risks of such an investment.
Reports based on technical and derivative analysis center on studying charts of a stock's price movement, outstanding positions and
trading volume, as opposed to focusing on a company's fundamentals and, as such, may not match with a report on a company's
fundamentals. Investors are advised to refer the Fundamental and Technical Research Reports available on our website to evaluate the
contrary view, if any.
The information in this document has been printed on the basis of publicly available information, internal data and other reliable
sources believed to be true, but we do not represent that it is accurate or complete and it should not be relied on as such, as this
document is for general guidance only. Angel Broking Pvt. Limited or any of its affiliates/ group companies shall not be in any way
responsible for any loss or damage that may arise to any person from any inadvertent error in the information contained in this report.
Angel Broking Pvt. Limited has not independently verified all the information contained within this document. Accordingly, we cannot
testify, nor make any representation or warranty, express or implied, to the accuracy, contents or data contained within this document.
While Angel Broking Pvt. Limited endeavors to update on a reasonable basis the information discussed in this material, there may be
regulatory, compliance, or other reasons that prevent us from doing so.
This document is being supplied to you solely for your information, and its contents, information or data may not be reproduced,
redistributed or passed on, directly or indirectly.
Neither Angel Broking Pvt. Limited, nor its directors, employees or affiliates shall be liable for any loss or damage that may arise from
or in connection with the use of this information.